


RBA Payments Data
Trend Analysis
March - 2024
TRANSACTION VALUES
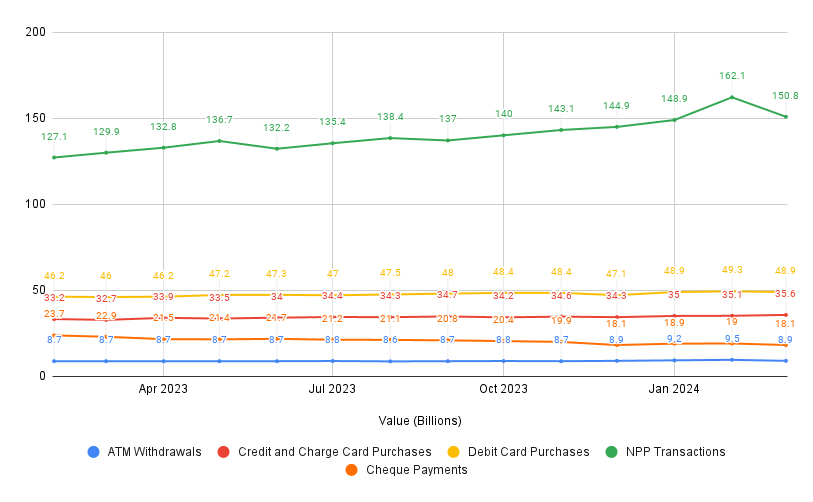
TRANSACTION VALUES
Values across all payment types remained relatively consistent for the month with consistent growth rates for most products.
- ATM values grew by 2.7% which is down on the February growth of 9.5% but March represents the 5th consecutive month of positive growth so some slowing should be expected.
- Credit card values grew significantly in March at 8.1% this is compared to an average growth of 5% for the previous 5 months.
- Credits value growth came at the expense of debit which grew at 6.1% against a 5 month average of 7.6%.
- We assume that the cost of living crisis is driving people to use credit as debit savings start to run out. It will be interesting to watch this trend in the next few months.
- NPP values dropped to $150.8Bn from their February high of $162.1Bn but $150Bn is closer to their recent average so February seems to be an anomaly.
- Cheque values dropped to their lowest level for 12 months at $18.1Bn
TRANSACTION VOLUMES
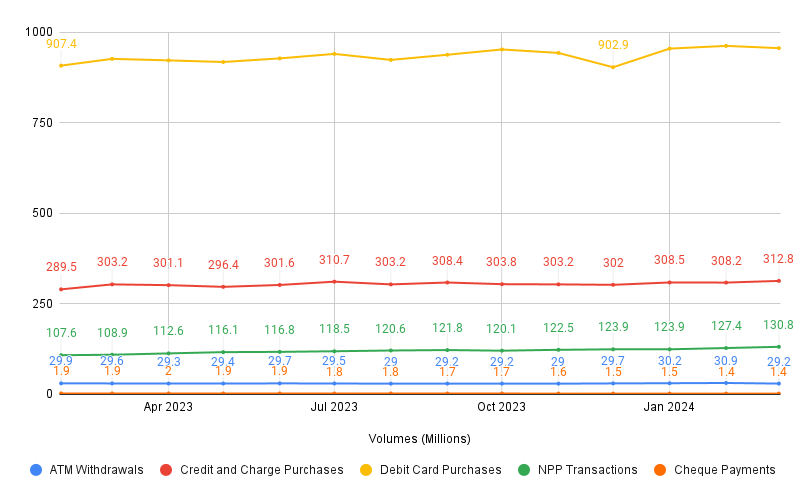
TRANSACTION Volumes
There was movement in payment volumes and a general activity reduction across all payment types except for NPP.
- ATM volumes dropped back below 30M transaction to 29.2M transactions which is closer to its average level during most of 2023.
- Total card transactions fell from 1270M in Feb to 1268M in March driven by the movement from debit to credit.
- Credit card volumes grew significantly in March to 312M this is compared to an average of 305M for the previous 7 months.
- Credits volume growth also impacted debit shrank to 955M from February’s 961M transactions
- Again, we assume that the cost of living crisis is driving people to use credit as debit savings start to run out. It will be interesting to watch this trend in the next few months.
- NPP volumes continued to climb to 130M their highest ever month. With flat value we assume that PayTo transactions at lower values are driving volume growth but having less impact on overall values.
- Like cheque values cheque volumes also dropped to their lowest level for 12 months at 1.4M cheques processed.

Avg Transaction values - Cards
$66.69
0.5%

$113.81
0%

$51.17
0%
All cards
Credt cards
debit cards
There was little month on month growth in value across any of the card groupings either as a total or split into credit/charge cards or debit cards. This is consistent with the metrics from February as well.
AVG TRANSACTION VALUES - NON CARDS
$304.79
1%

$1,152.91
9.4%
$12,928.57
4.7%
ATM Withdrawals
npp
cheQUES
- There was a slight drop in average ATM withdrawal values. This drop offsets the slight increase of 1% seen in the Feb numbers.
- NPP saw a reasonably significant drop in average transaction values. This was caused largely by a decline in the value growth rate against previous months. We expect that PayTo will contribute to a long term reduction in average transaction sizes for NPP compared to their historical levels.
- Cheques saw a reasonable drop in average values driven by a reduction in values processed. Volumes remained the same but values were the lowest the have been for 12 months.
Process
Each month the RBA releases the payments data it has collected across ATM’s, cards, NPP and cheques on its website. There is a two month delay in the data being published.
This report collects the data from the RBA website, then we perform some basic calculations and look at the trends to determine the underlying factors and behaviours happening in the payments market.
We hope that our analysis is both informative and insightful for readers.
This report is prepared for general information and can be shared within your organisation as required.
Contact Us
If you have any questions or comments about the report please feel free to reach out using the contact details below.
Disclaimer: The financial analysis presented is based on assumptions and is intended for informational purposes only. The author makes no guarantees regarding the accuracy of the forecasts and expressly disclaims any liability for errors or omissions. Readers are advised not to base financial decisions solely on this report.

+61 415 936 201

admin@stuarthaughey.com
Thank you!